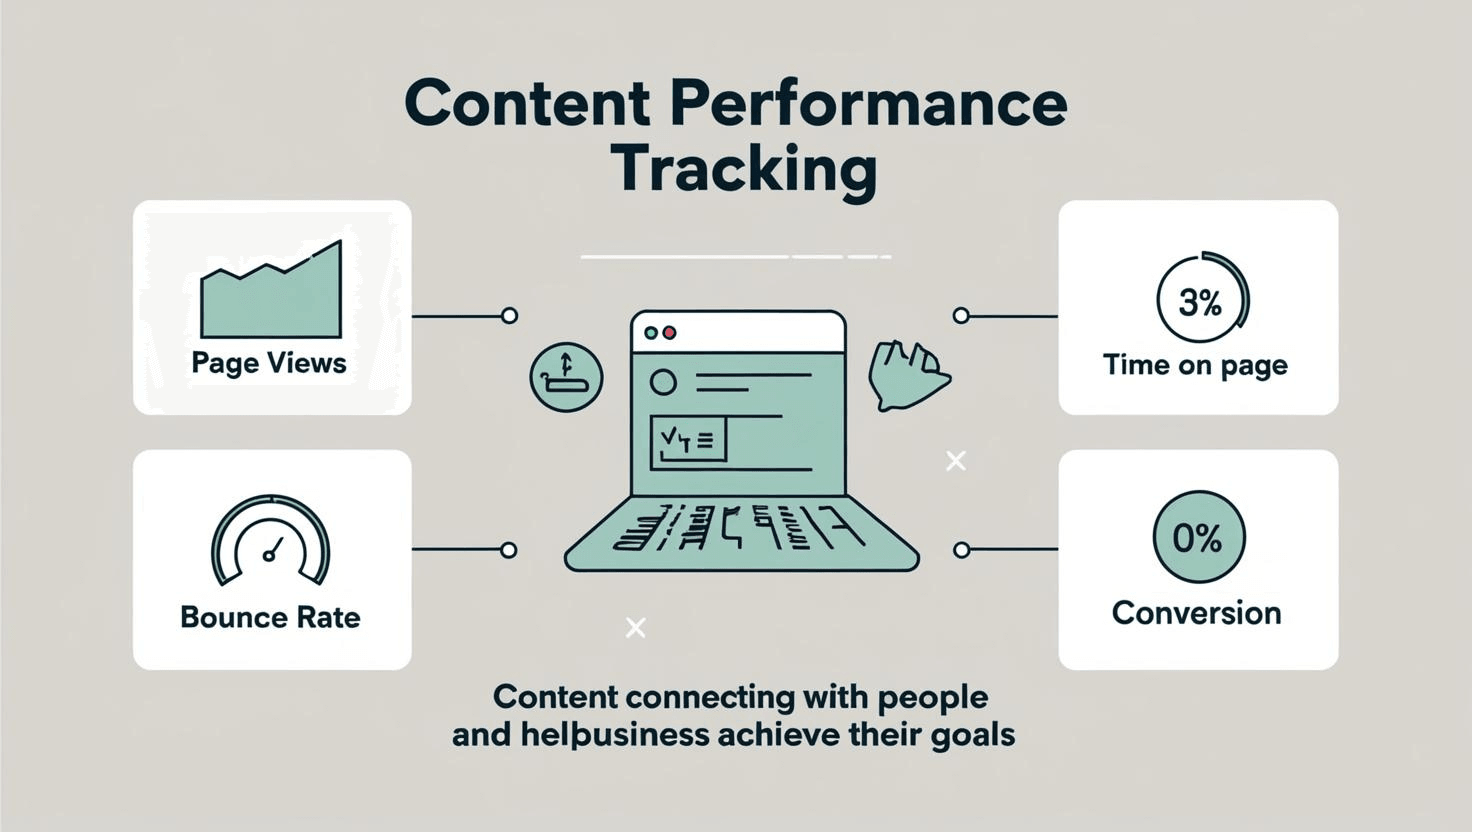
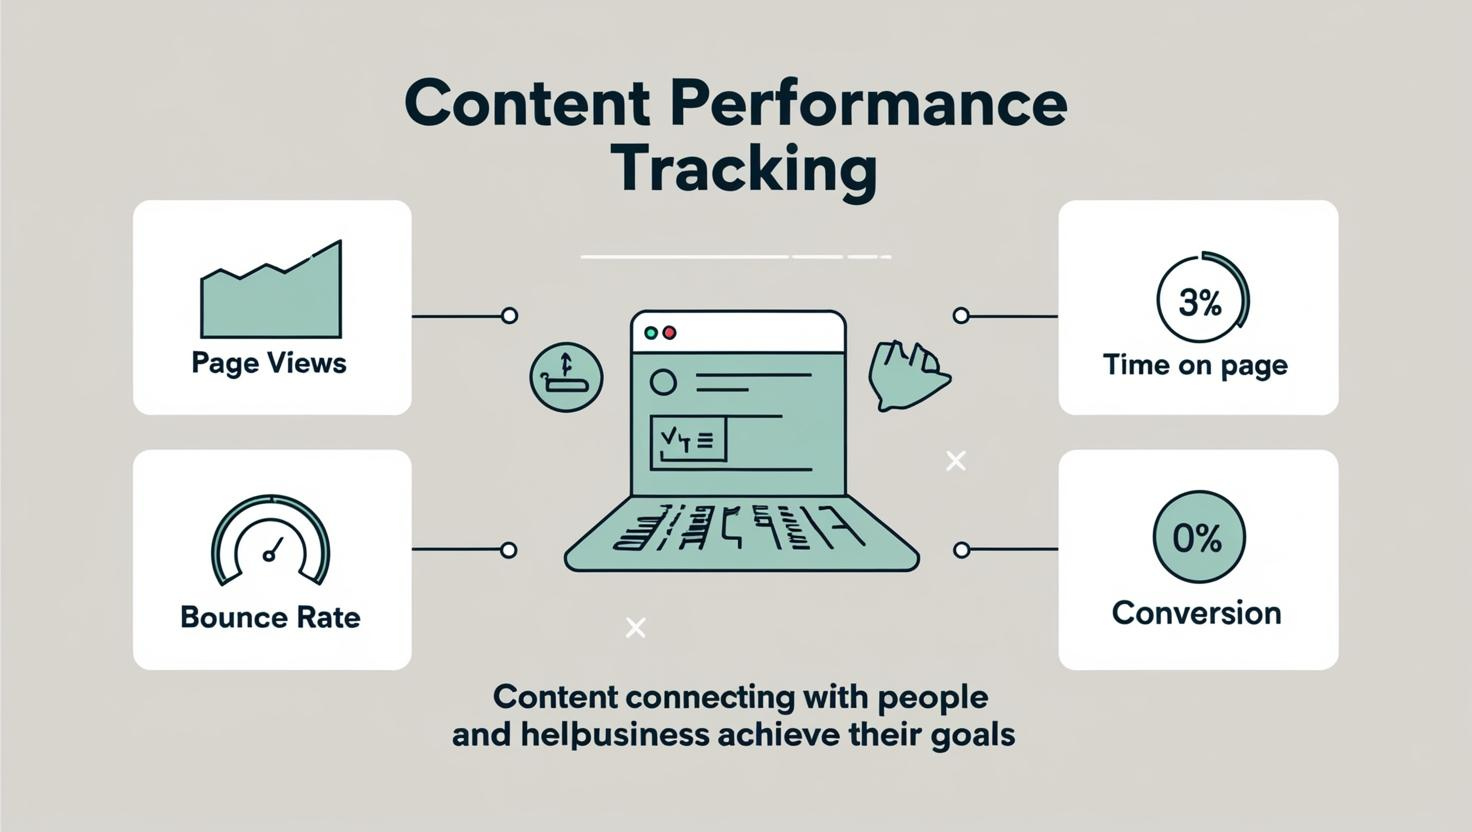
What is Content Performance Tracking?
Content performance tracking is all about checking how different types of online content, like blog posts, videos, and social media updates, are connecting with people and helping the business reach its goals.
You look at things like how many views a page gets, how long people stay on it, bounce rates, and if people are taking action, like making a purchase.
Tools like Google Analytics, Ahrefs, and social media stats help businesses understand how far their content goes, how people behave, and whether they’re getting a good return on their investment.
These insights help businesses make smart choices to improve content and keep it on track with what people want.
Advanced Metrics for In-Depth Analysis
If you want to really get how well your content is doing and how much it connects with your audience, it's time to look beyond the basics. Let's take a deeper dive into some of these metrics:
1. Engagement Metrics
Engagement metrics are like tools that help you see how people are interacting with your website or content. They don’t just count how many visitors you have; they show you how much people are really getting into what you’re offering. Here’s a simple look at some important engagement metrics:
Scroll Depth:
Scroll depth tells you how far down the page people scroll, showing how much they’re into your content.
For example, if someone scrolls 50% of the way, it means they saw half of your page. Watching scroll depth helps you figure out where people start losing interest.
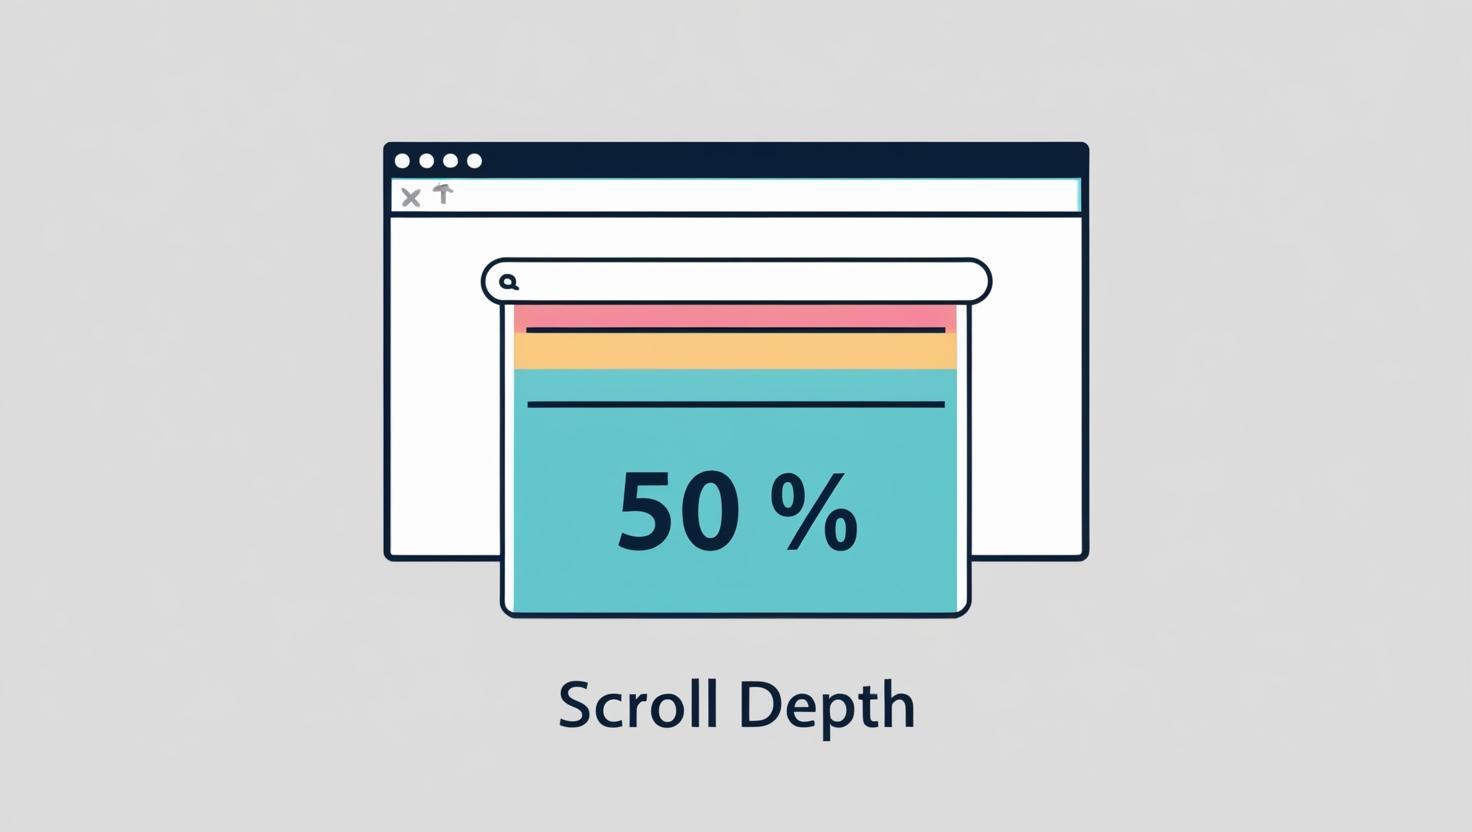
That way, you can make your page layout better and maybe shorten or change the content to keep people engaged.
Time on Page:
Time on Page tells us how long someone stays on a webpage before they click somewhere else.
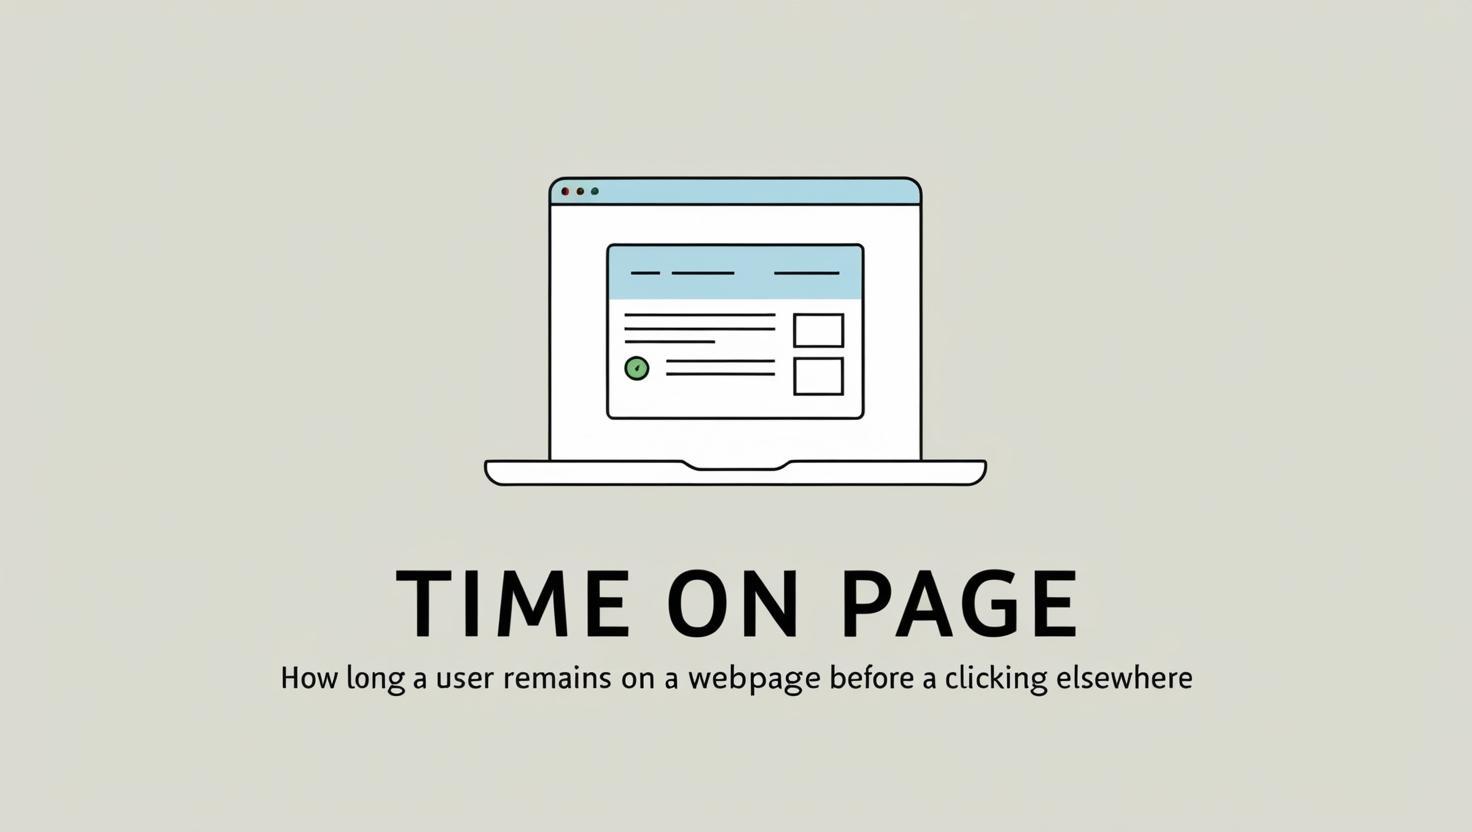
It’s calculated by checking when they land on the page and how long they stay there before moving on. The more time people spend on a page, the more likely they are enjoying the content.
But here’s the thing: if they leave the site from that page without doing anything else, the time might not be counted right. That’s because most tools can’t track the time spent on the last page in a session
Click Heatmaps:
These engagement metrics show where people click on a webpage. It uses colors to show how often people click on certain areas.
The hotter the color (like red), the more clicks that spot gets, and cooler colors (like blue) mean fewer clicks. This helps you figure out what people care about on your page and what they ignore.
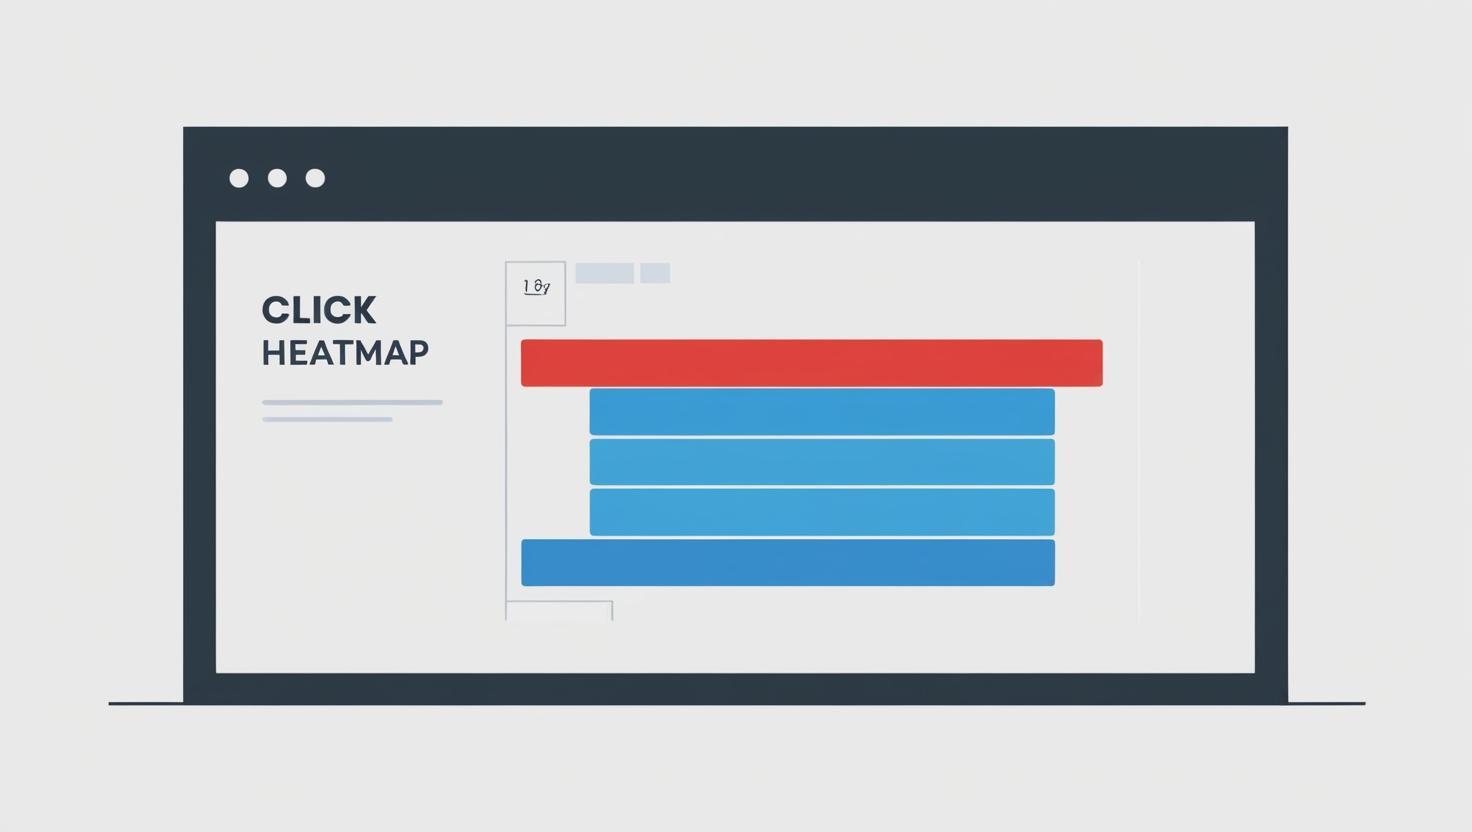
By looking at the heatmap, website owners can make changes to their site to improve how it looks, make it easier to use, and get more people to take action.
2. Conversion Metrics
Conversion metrics help you see how well your website or marketing is turning visitors into customers or leads. They show if people are doing what you want them to do, like buying something or signing up for a newsletter.
These metrics are really important because they tell you if your marketing is working and where you can get better. Here are some key conversion metrics:
Conversion Rate:
The conversion rate shows how many people who visit your website actually do something you want them to do, like buying something or signing up for your newsletter.
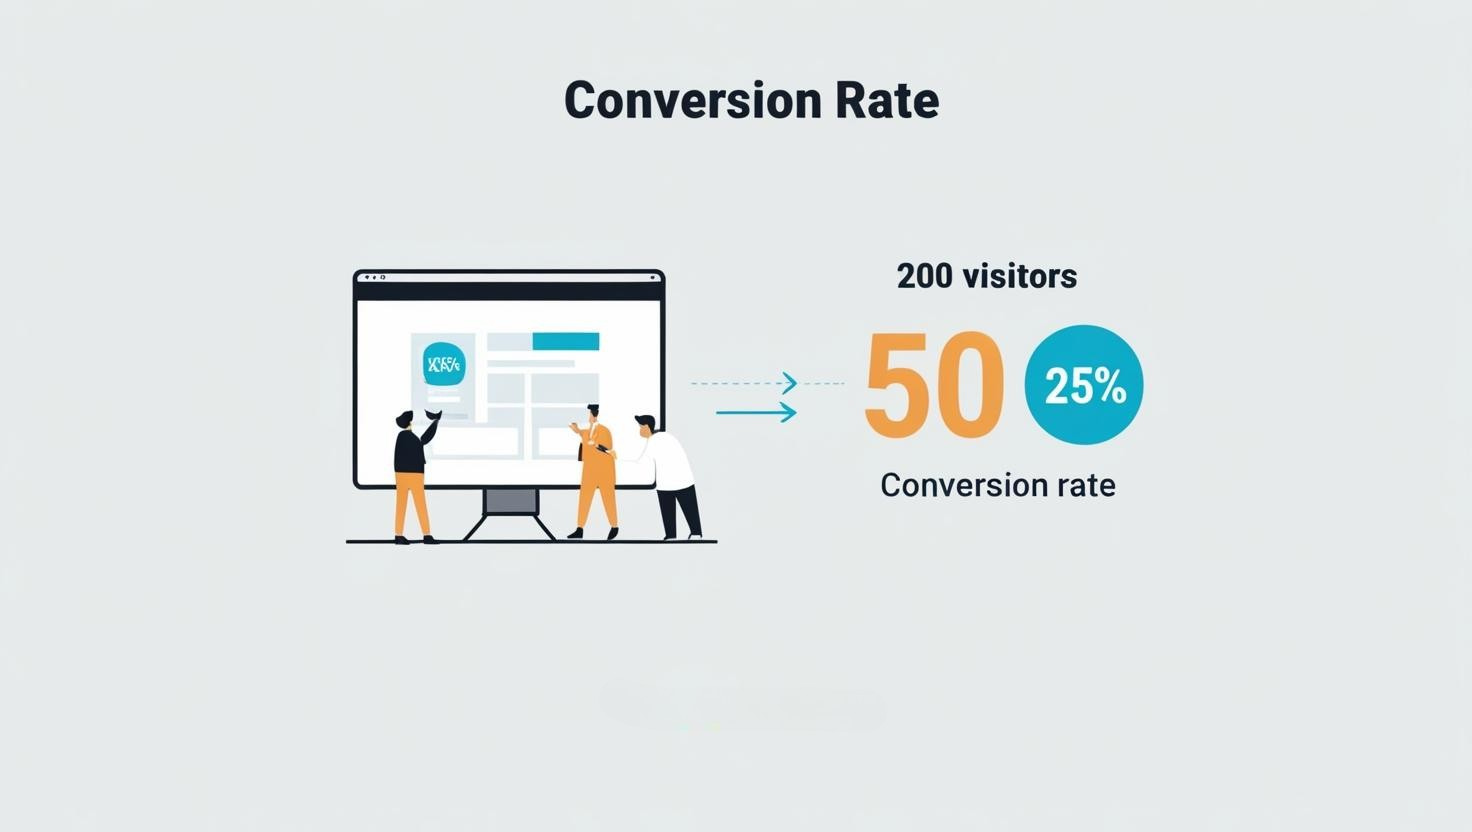
You find it by dividing the number of people who take action by the total number of visitors and then multiplying by 100. For example, if 200 people visit your site and 50 of them buy something, your conversion rate is 25%.
A higher conversion rate means your website is doing a good job getting people to act, and it shows that your marketing and website design are working.
Click-Through Rate (CTR):
CTR shows how many people actually click on a link or ad after they see it. You find it by dividing the number of clicks by the number of times the ad was shown, then multiply by 100 to turn it into a percentage.
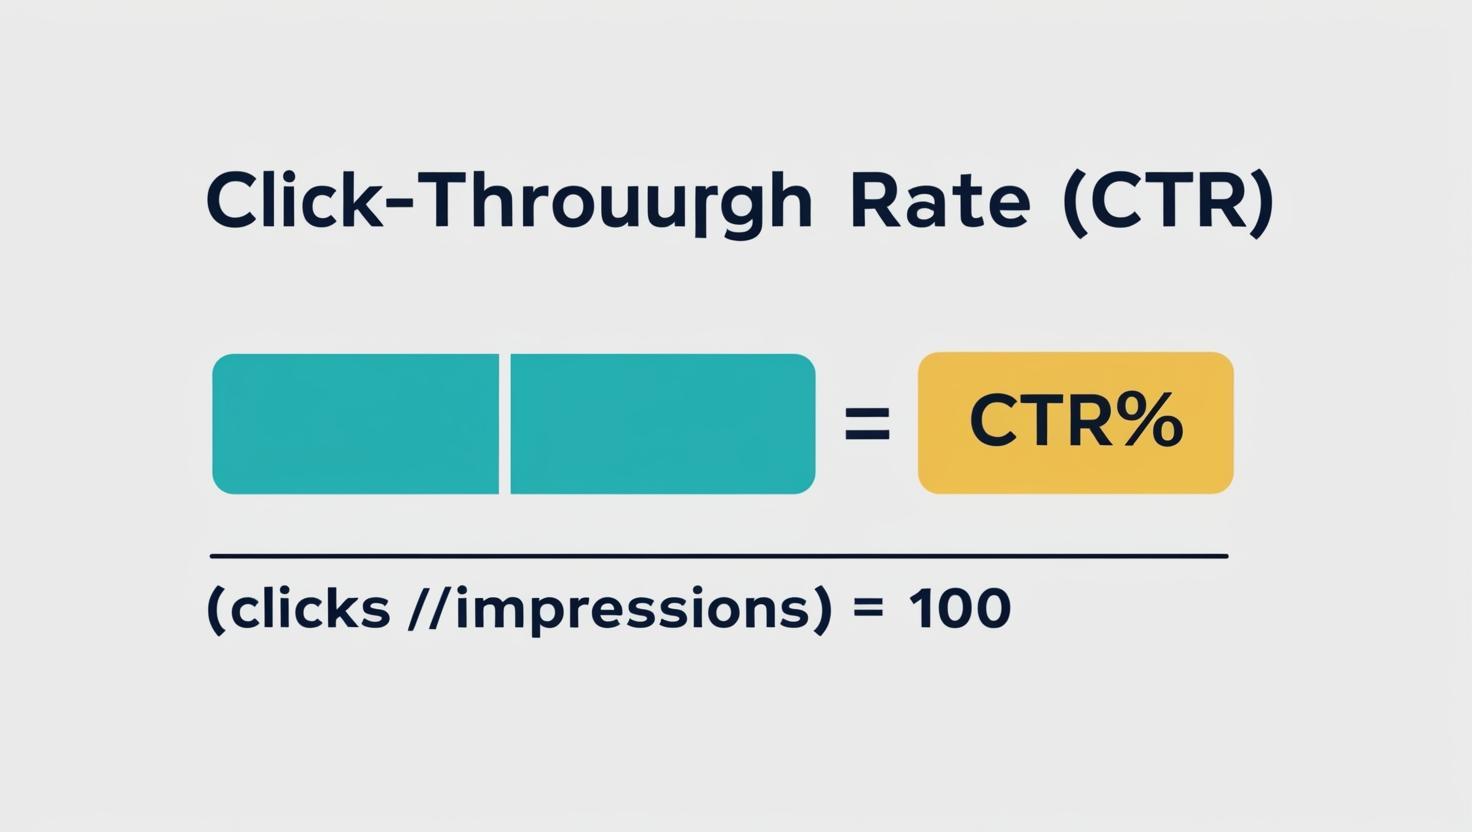
So, if your ad shows up 1,000 times and gets clicked 50 times, your CTR is 5%. A high CTR means more people are interested in what you're sharing, showing that the ad or link is working.
Checking your CTR helps you figure out if your marketing is going well or if you need to change something.
You can track conversion rates in Google Analytics. Here’s how you can do it in GA4:
1. Go to Admin Settings: Log in to GA4 and head to the Admin panel.
2. Create a Custom Event:
- Under the "Property" section, click on "Events."
- Hit "Create Event," then "Create."
- Give your event a name, like “form_submission.”
- Set the conditions for when the event should trigger (like when someone hits a specific URL or does something specific).
3. Mark It as a Conversion:
- In the Admin panel, select "Conversions."
- Click "New Conversion Event."
- Type in the name of the event you just created.
- Hit Save.
Now, GA4 will track your event as a conversion, and you can start checking your conversion data.
Cost Per Acquisition (CPA):
CPA is the cost a company spends to get a new customer through marketing. You find it by dividing the total money spent on marketing by how many new customers were gained.
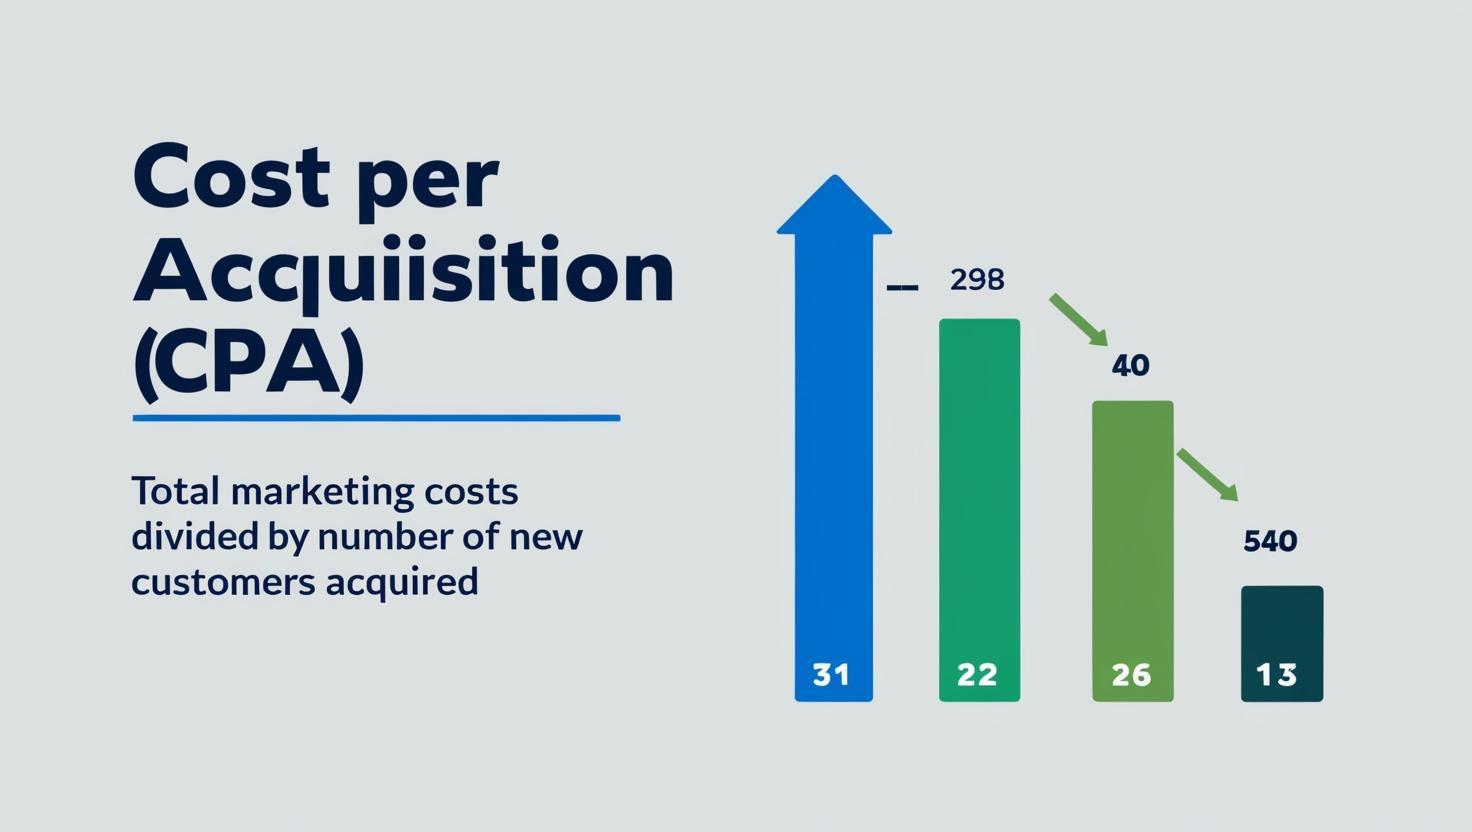
For example, if a business spends $1,000 on an ad campaign and gets 50 new customers, the CPA is $20. Keeping an eye on CPA helps businesses figure out if their marketing is working well.
If the CPA is low, that means the company is getting customers without spending too much, which is great for making more profit.
Return on Ad Spend (ROAS):
ROAS tells you how much money you make from every dollar you spend on ads. To figure it out, just divide the sales from your ads by how much you paid for them.
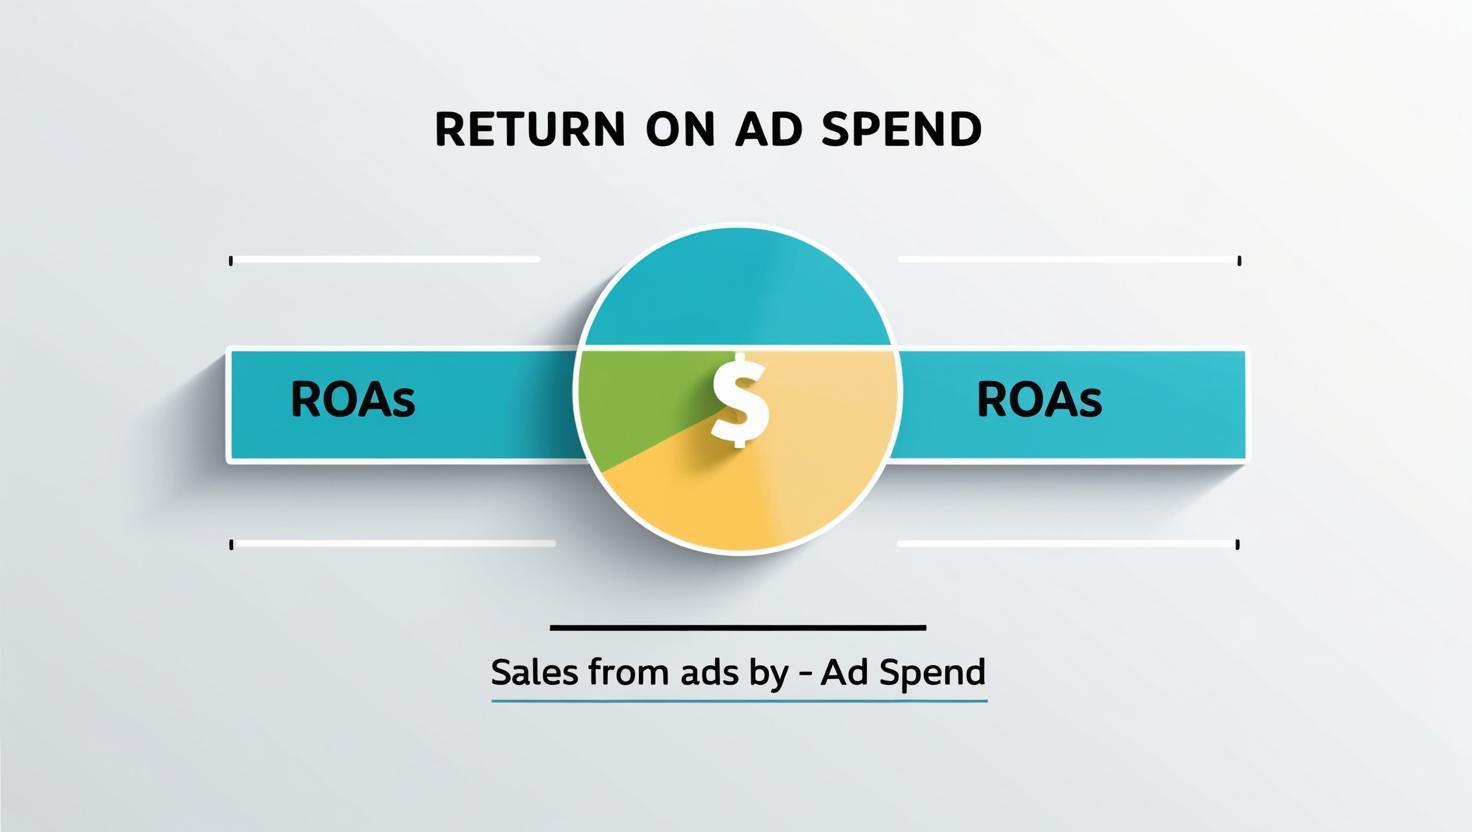
For example, if you spent $1,000 on ads and made $5,000 in sales, your ROAS would be 5:1, which means you earned $5 for every $1 spent. A bigger ROAS means your ads are doing a great job.
Checking your ROAS helps you know if your ad budget is working or if you need to tweak things.
Average Order Value (AOV):
AOV is a simple way to see how much people spend when they buy something from your online store. To find it, just take the total money you made and divide it by the number of orders.
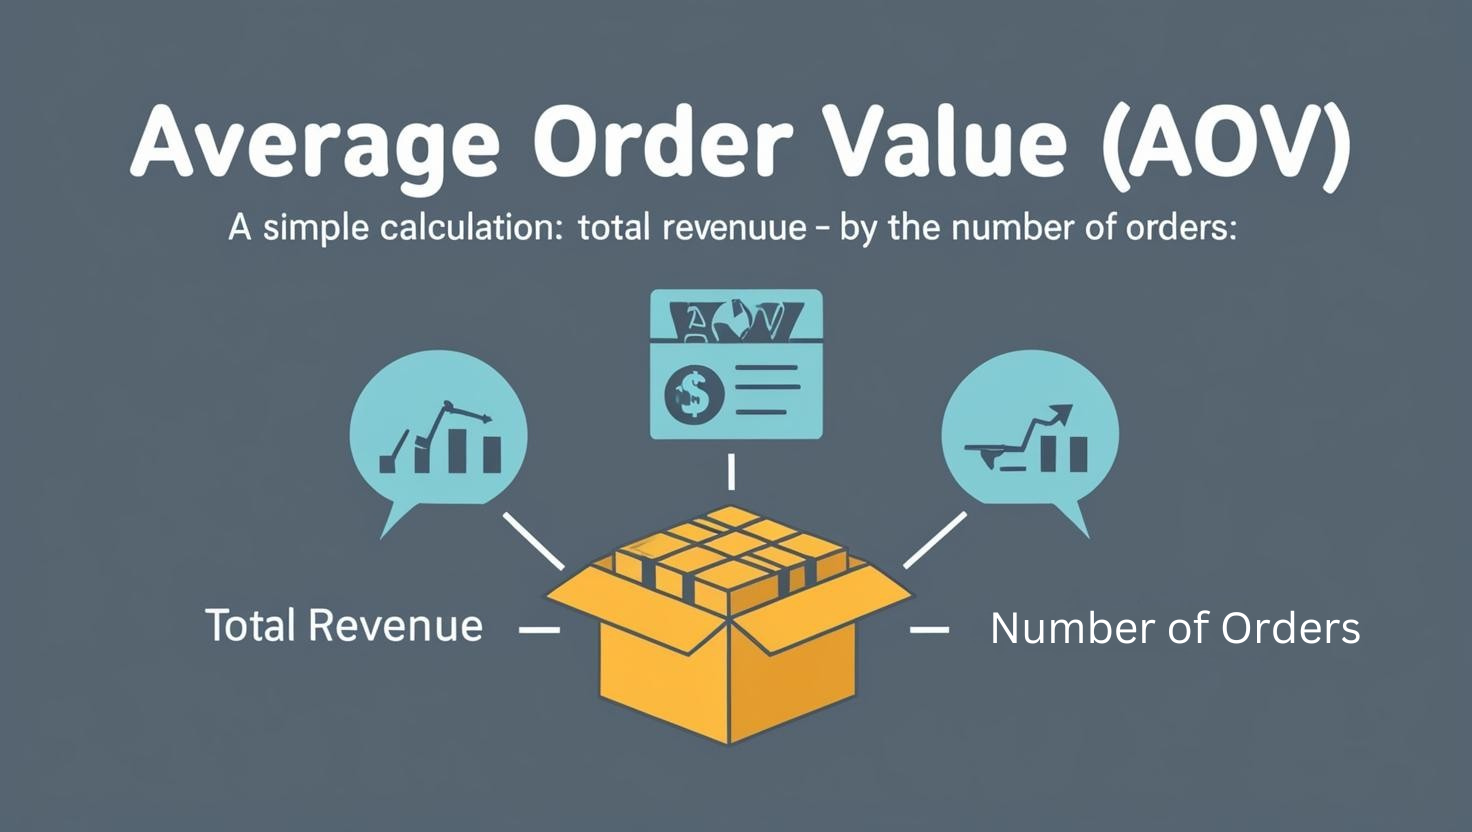
For example, if you made $5,000 from 200 orders, the AOV is $25. Keeping an eye on AOV helps you figure out how customers buy and gives you ideas on how to get them to spend more, like offering bundles or free shipping for bigger orders.
Getting a higher AOV can help you make more money without needing to find new customers.
Content ROI:
Content ROI is all about seeing how much money you made from your content compared to how much you spent to create and share it. It helps you figure out if your content is working for you.
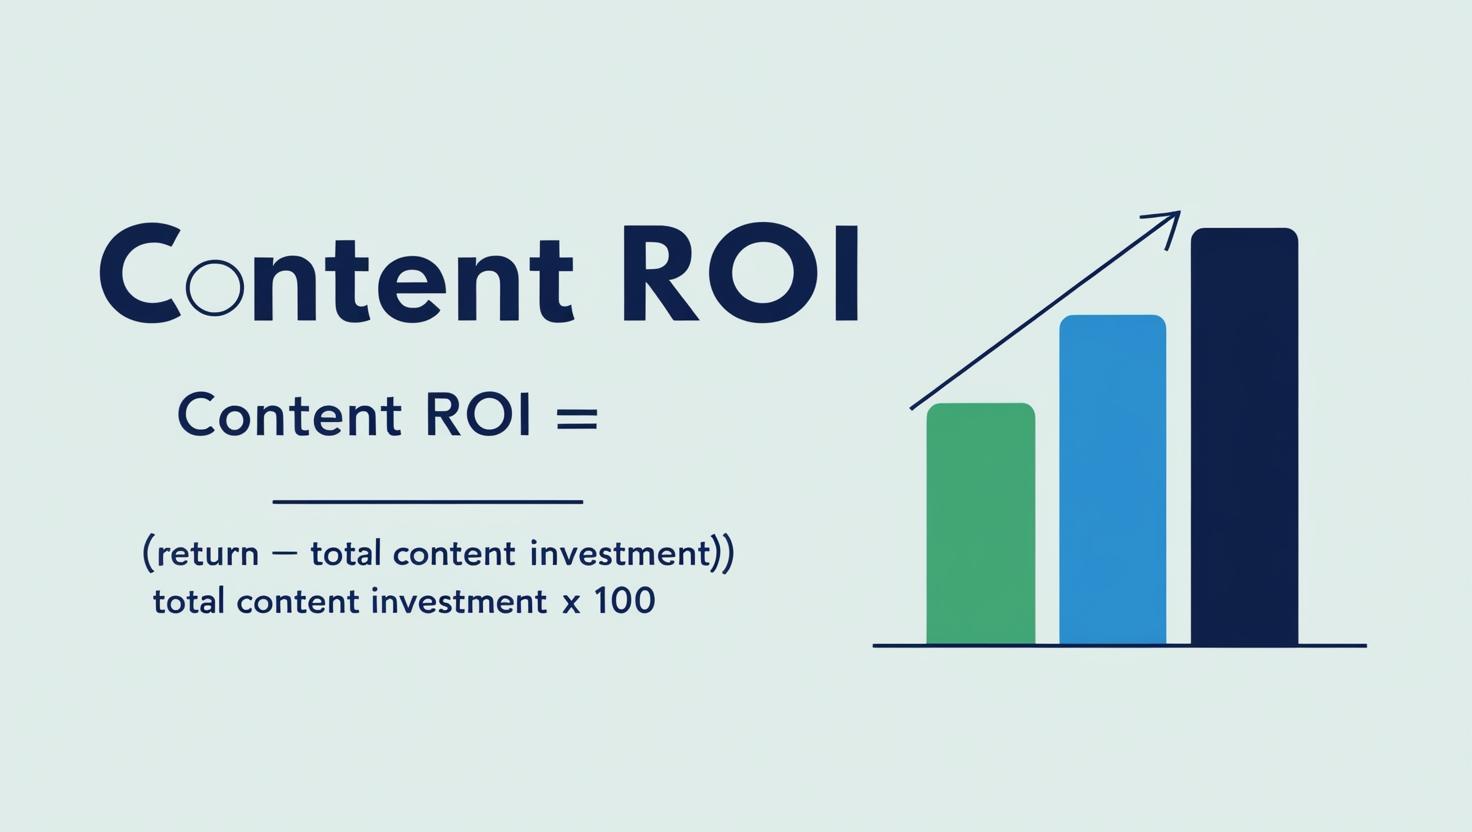
If your ROI is high, it’s a good reason to ask for more budget. But if it’s low, you know it’s time to tweak things and get better results.
Here’s the simple way to calculate it:
Content ROI = ((Return - Total Content Investment) / Total Content Investment) x 100
For example, let’s say your blog made $10,000 in sales and you spent $2,500 on creating and sharing it. That means your content ROI is 300%.
3. SEO Metrics
SEO metrics are numbers that show how well a website is doing in search results. They help you see if people are finding your site and sticking around. By tracking these, you can make smart changes to get more visitors and keep them engaged.
Let's break down some key metrics in simple terms:
Dwell Time:
Dwell time is just how long users stick around on your page before clicking back to the search results. If people are bouncing off your page fast, it might mean your content isn’t matching what they were looking for.
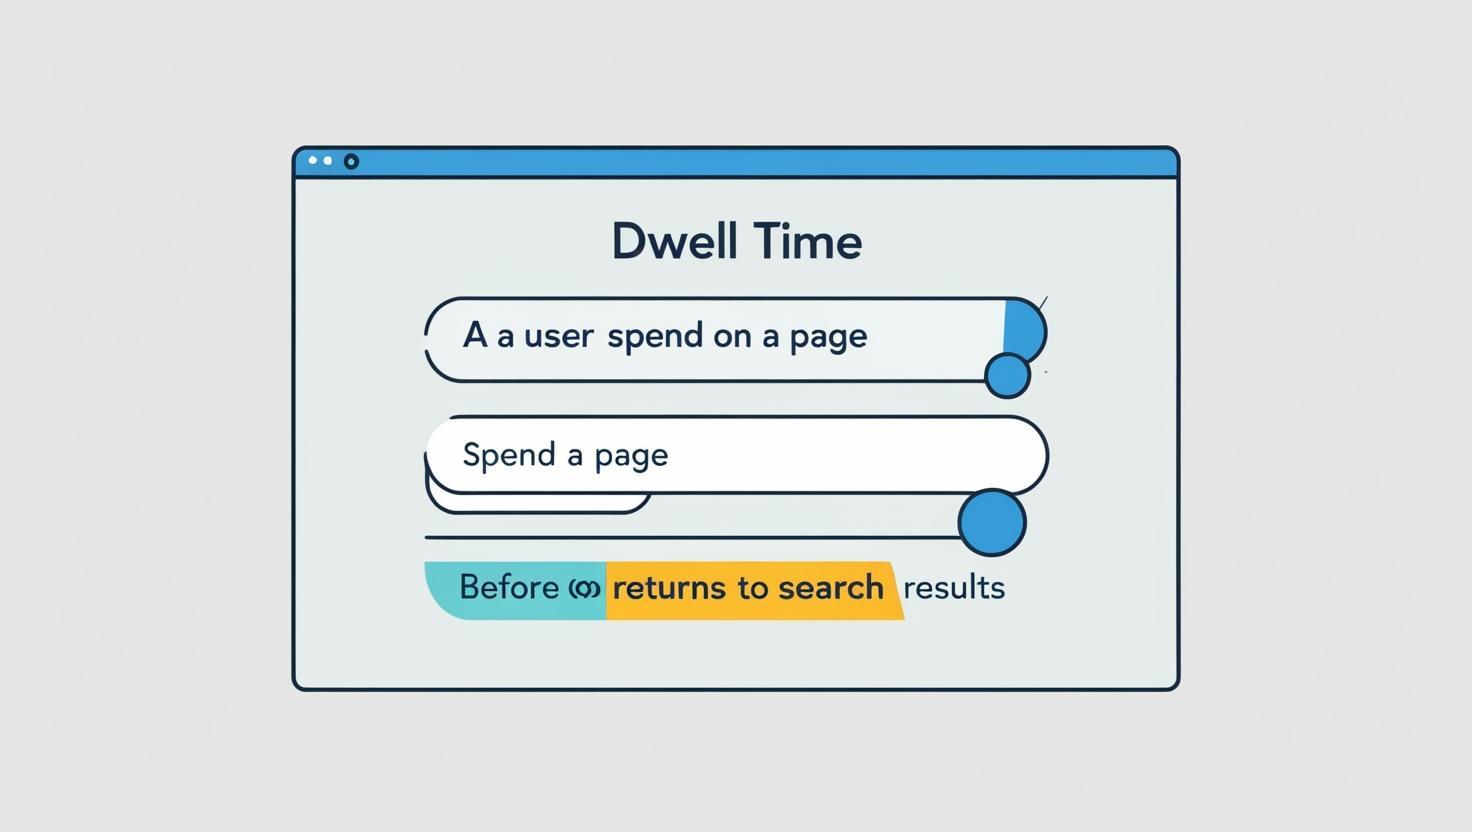
Even though there’s no official way to measure it, the new GA4 metric called "Average engagement time per session" is pretty close. Here’s how to check it:
- Go to Google Analytics.
- On the left, click “Reports.”
- Then, click on “Engagement” and choose “Landing page.”
You’ll find a list of pages that people visit first when they come to your website.
The "Average engagement time per session" shows how long someone stays on your site before they leave.
Organic Traffic:
Organic traffic is when people visit your website without clicking on ads. They find your site by searching on Google, Bing, or other search engines and choosing your page from the results.
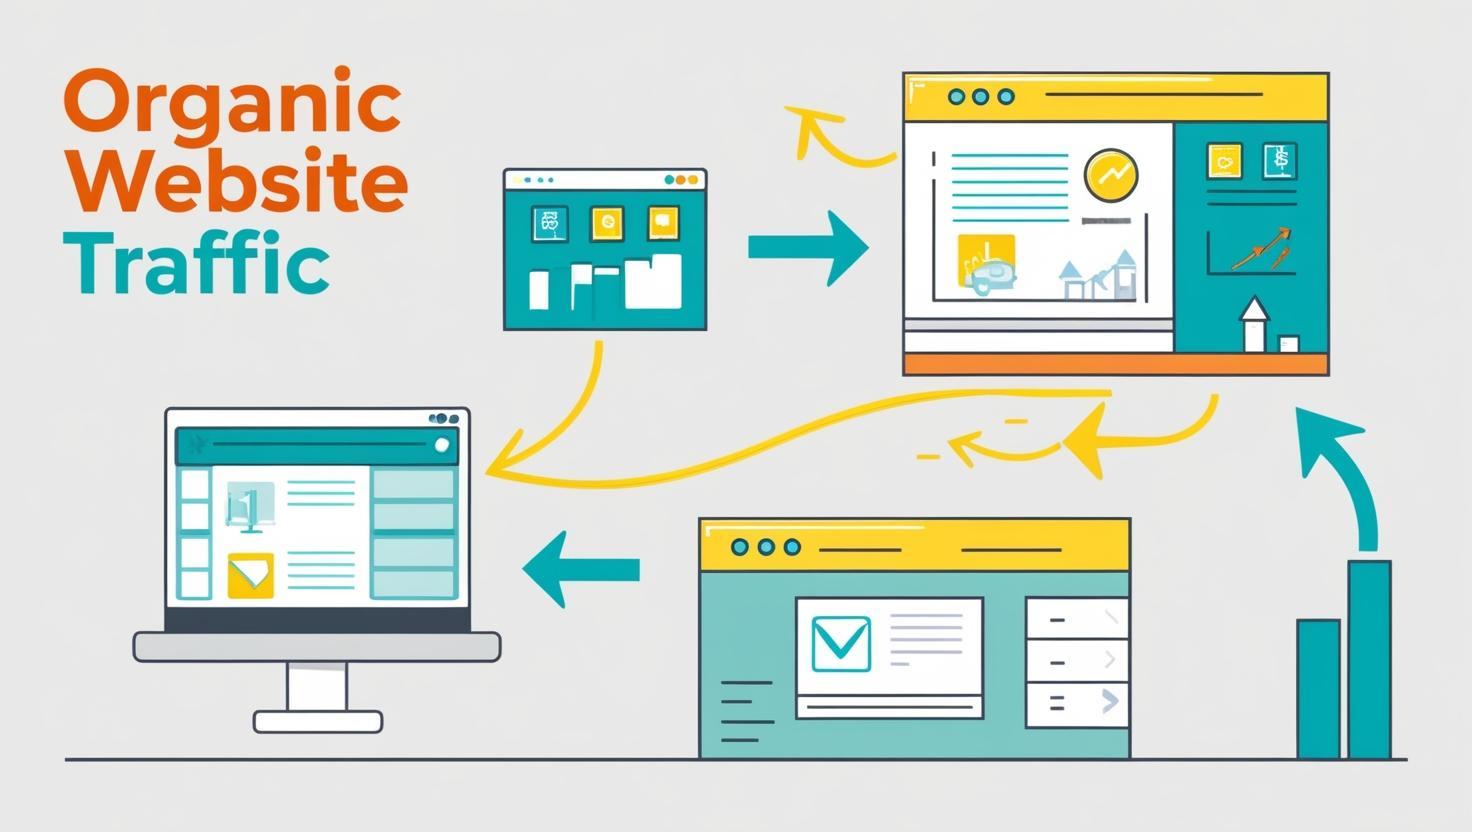
Since these visitors are looking for exactly what you offer, they’re more likely to stay, read, and trust your content. If you want more organic traffic, you need strong SEO strategies.
Good SEO helps your website show up higher in search results, making it easier for people to find you.
To check how much organic traffic you're getting, just log into Google Analytics. Then, on the left side, click on “Reports,” go to “Acquisition,” and then hit “Traffic Acquisition.”
You'll see a simple breakdown of where your website traffic is coming from.
Keyword Rankings:
Keyword rankings tell you where your pages show up in search results for the words people are looking for.
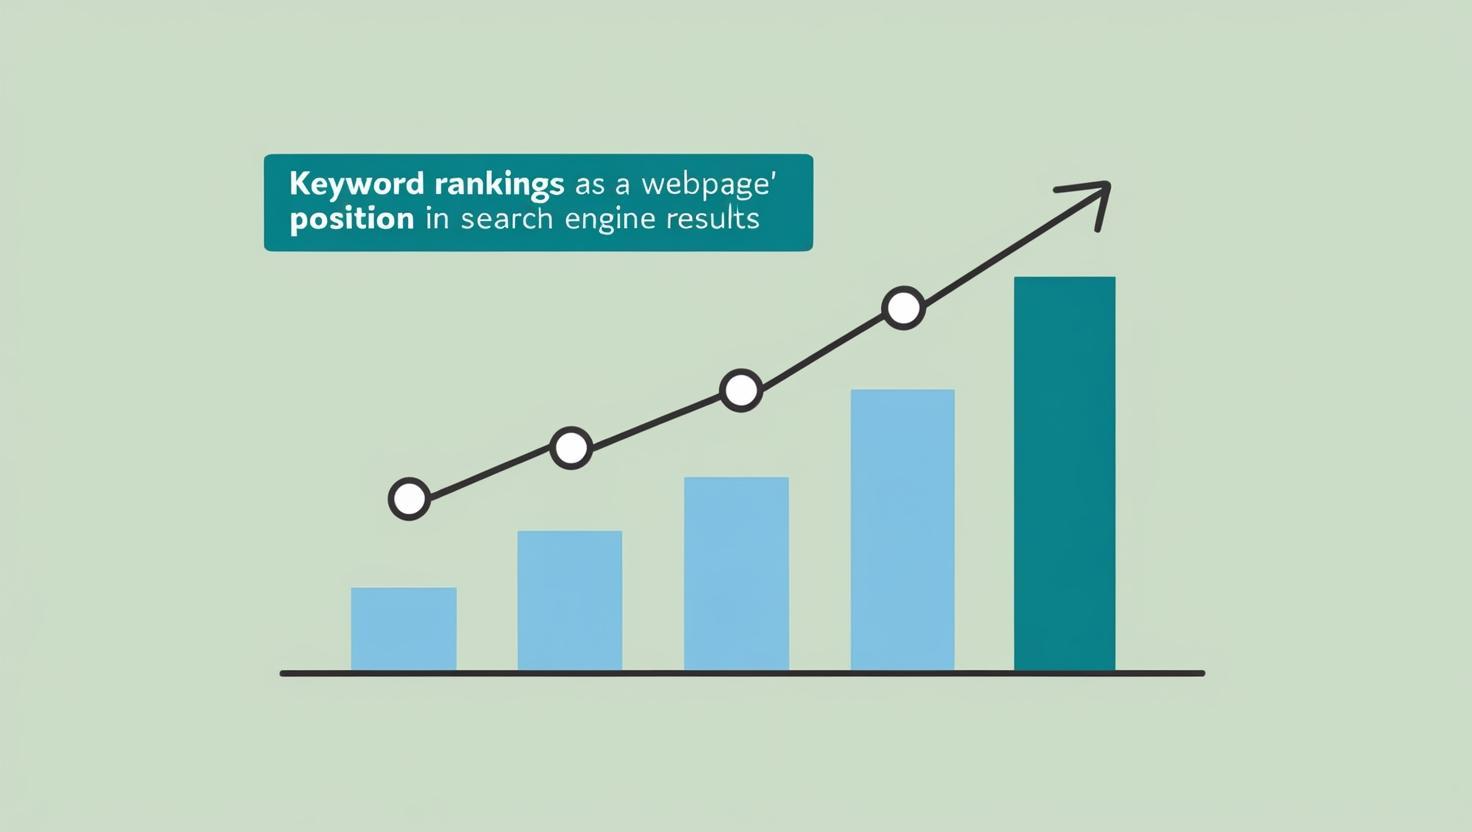
By checking your rankings, you'll know if your content is getting seen by the right people.
If you see a big drop in your rankings, you can act fast to figure out what's going on and fix it before it becomes a bigger problem.
Jaggery Consulting's Rank tracker makes it super easy to track a lot of keywords for your site.
Backlinks:
Backlinks are just links from other websites that point to yours. Think of them like online shoutouts.
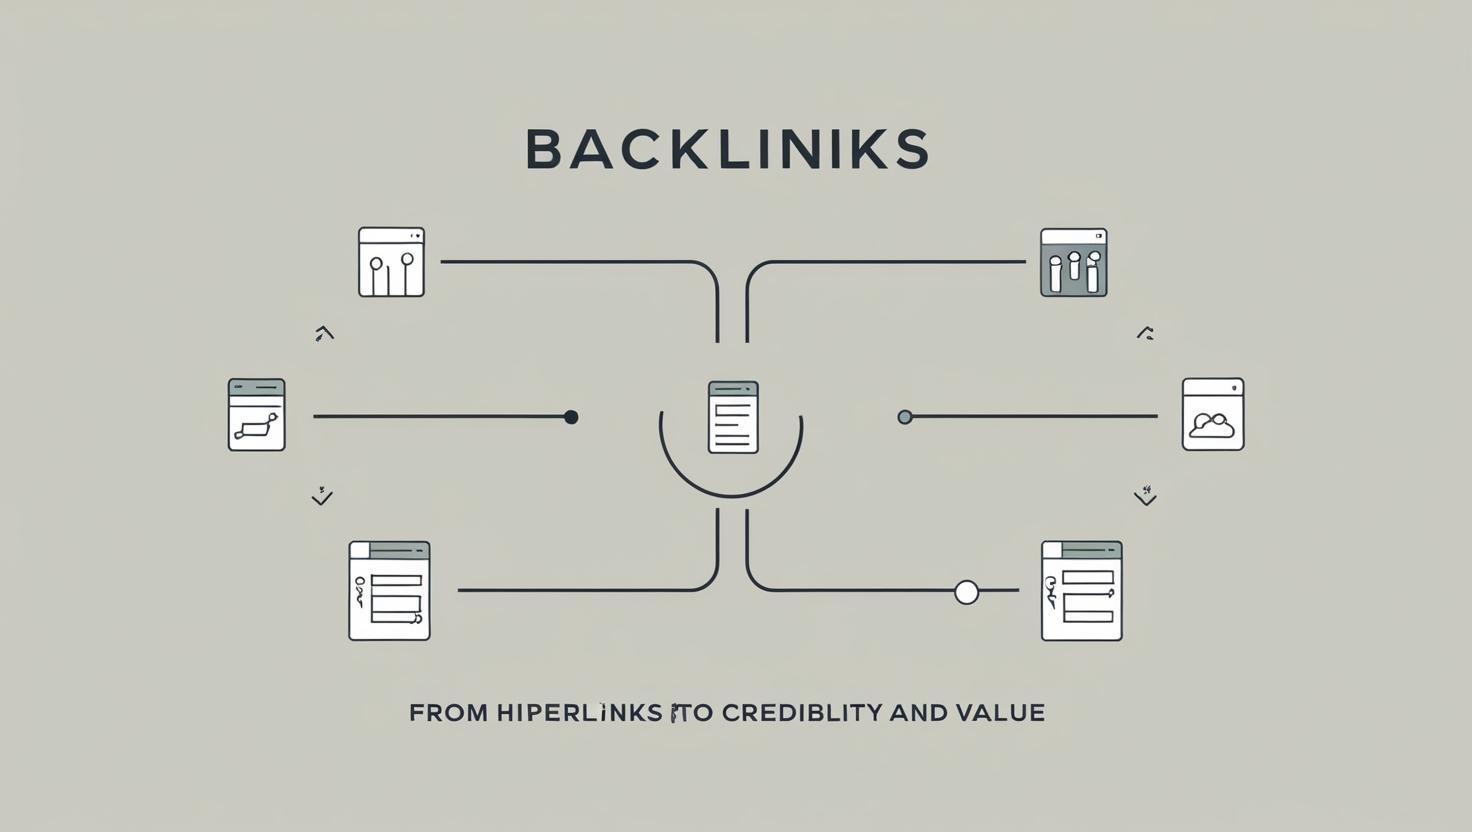
When a well-known site links to your content, it tells search engines that your stuff is legit and worth reading. This can help your website show up higher in search results and bring in more visitors.
But not all links are good—if sketchy or low-quality sites link to you, it could actually hurt your site’s ranking. That’s why it’s super important to get links from trusted and respected websites.
Remember: If you have more backlinks than referring domains, it means some websites are linking to your page multiple times.
If the page you made for PR and link building isn't getting links from important, relevant sites, you might need to reach out directly or try a different method to get those links.
4. Social Media Metrics
Social media metrics are numbers that show how well your posts are doing on sites like Facebook, Instagram, and Twitter.
They tell you if people like, share, or comment on your stuff. These numbers also help you see if your social media plan is actually working or if you need to change things up.
Here’s a simple way to understand them:
Share Rate:
The Share Rate tells you how often people share your content on social media. It shows how much they like it and want others to see it.
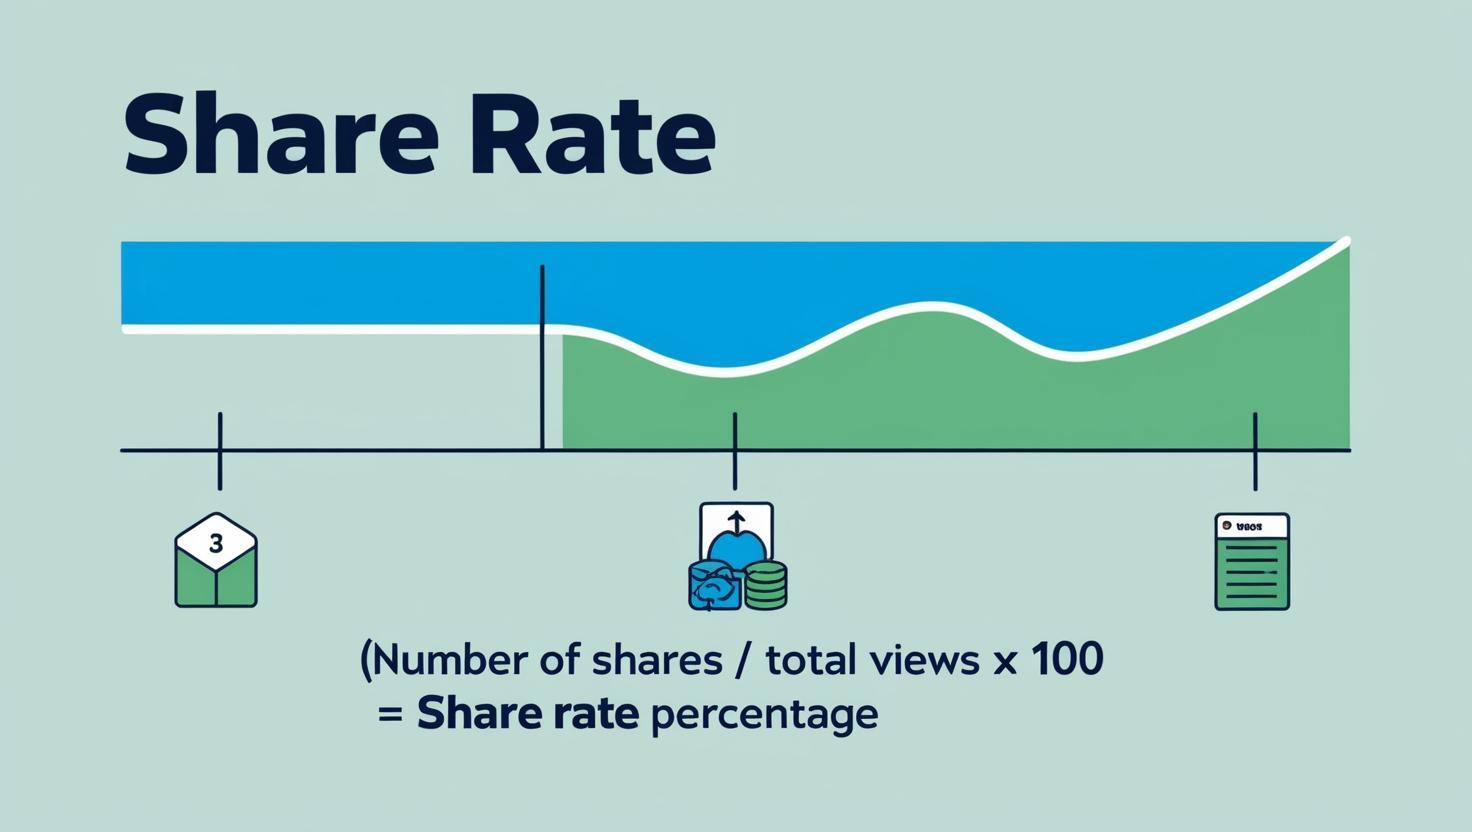
To find the Share Rate, just divide the number of shares by total views or interactions, then multiply by 100 to get a percentage. A high Share Rate means your content is interesting enough for people to pass it along.
Keeping an eye on this number helps you figure out what works best and how to make your posts even more shareable.
Comments and Discussions:
Keeping an eye on social media comments and conversations is super important. They show how people feel about your content and what grabs their interest. If a post gets a lot of comments, it’s a sign that people are really into it. More discussions mean more shares and better reach.

Paying attention to what people say can help you make your content even better and keep your audience happy. When you respond to feedback quickly, it shows you care, and that builds trust.
So, checking and responding to comments isn’t just helpful—it’s a must for growing a strong online presence.
5. Brand Awareness and Sentiment Metrics
Understanding how your brand is perceived by the public is crucial for building strong customer relationships and improving your marketing strategies. Two key aspects to monitor are Brand Awareness and Sentiment Analysis.
Brand Awareness:
Brand awareness is all about how well people recognize your brand—its name, logo, and what it sells. When customers know your brand, they’re more likely to pick your product instead of someone else’s because it feels familiar and trustworthy.
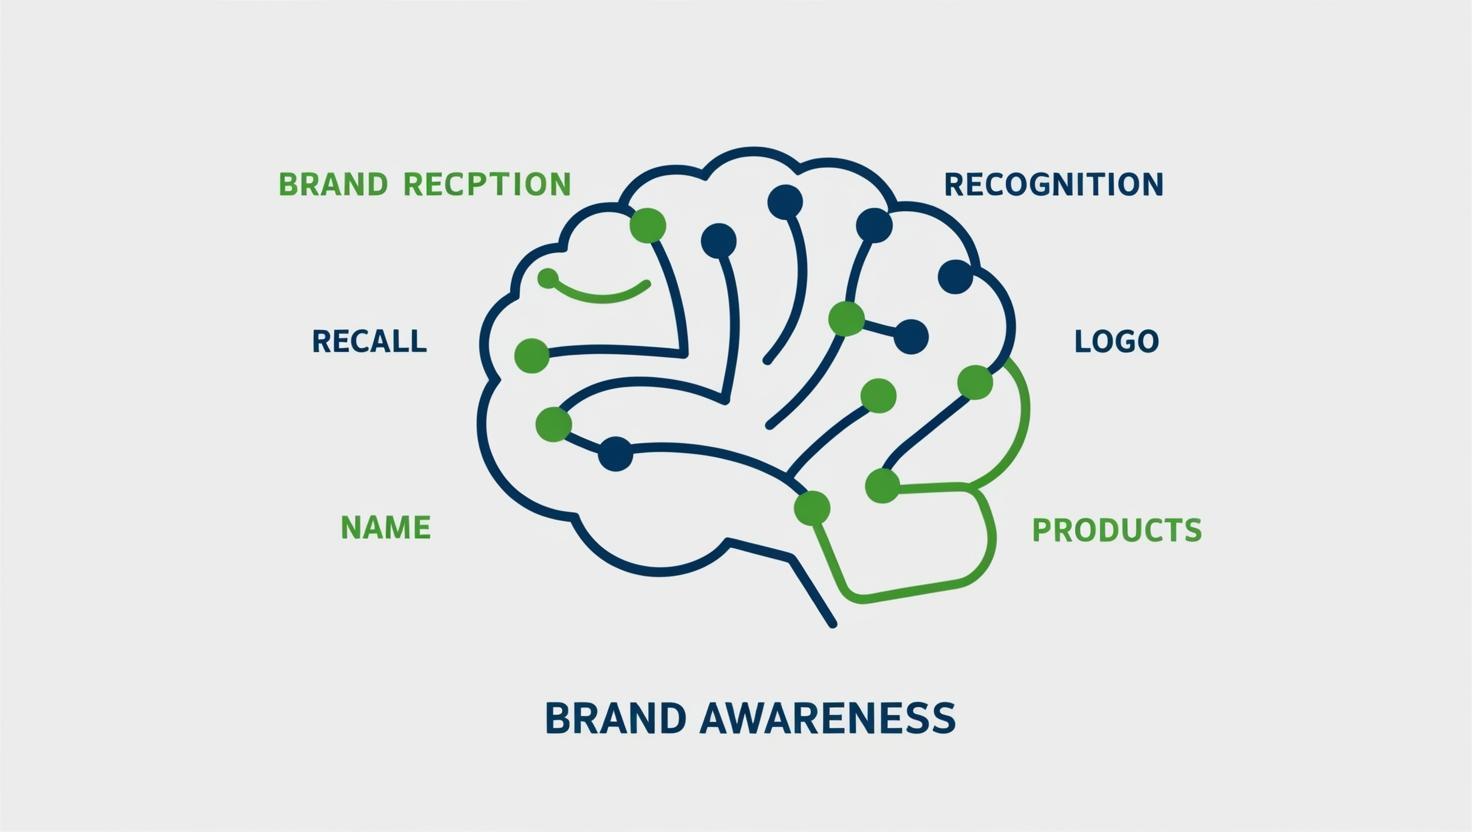
The more people recognize your brand, the stronger your presence in the market. To build brand awareness, businesses need to advertise, stay active on social media, and offer great products or services.
When done right, this brings in new customers and keeps the old ones coming back, helping the business grow.
Sentiment Analysis:
Sentiment analysis, or opinion mining, is when computers look at text to figure out how people feel about something. It checks if the feelings in the text are good, bad, or just neutral.
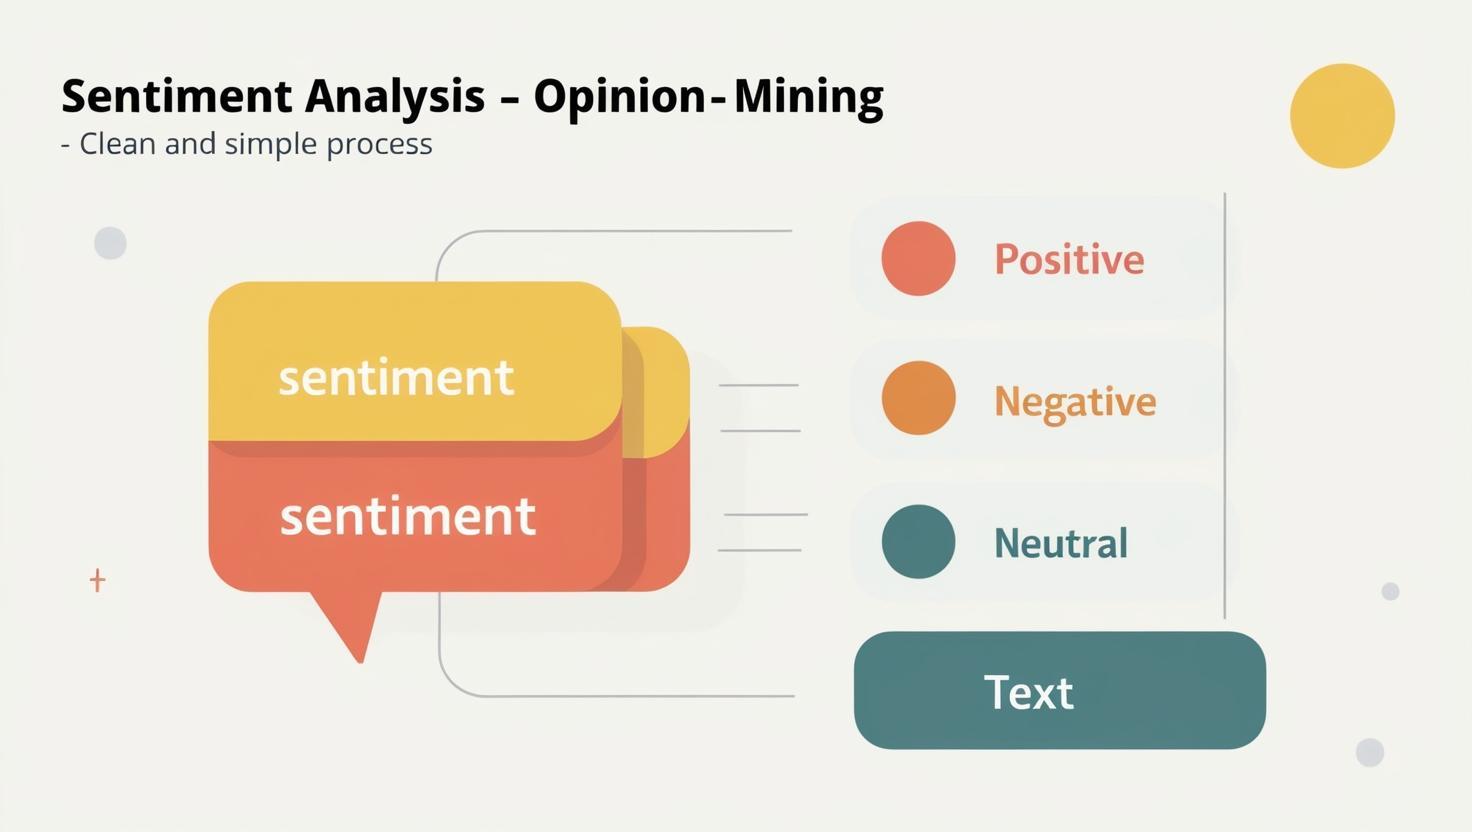
People use it to look at customer reviews, social media posts, and feedback. It helps businesses understand what people think about their products or services and how to make them better.
Instead of reading lots of feedback by hand, sentiment analysis lets machines do it fast, giving businesses useful info about what customers like or don't like.
6. Content Production Metrics
Content production metrics are just ways to check how well we’re making content. It looks at things like how long it takes to create content, whether we’re meeting deadlines, where the process gets stuck, and how much money it costs.
Keeping track of these numbers helps teams work better, finish content on time, and use resources wisely.
Time to Publish:
Time to publish is how long it takes from when you first come up with an idea for a piece of content until it gets published.
Tracking how long it takes helps content managers stay on top of things and figure out where things might be getting stuck.
If a piece is taking too long to publish, it might be a sign that there are problems with the workflow.
For example, maybe the briefs are hard to understand, the topics are tricky, or a team member is taking longer than expected to finish their part.
This number will depend a lot on your editorial process, how many revisions you need, and other things. There’s no perfect time you should aim for, but keeping track of it helps you spot areas that need improvement.
Here’s an example of what a workflow could look like:
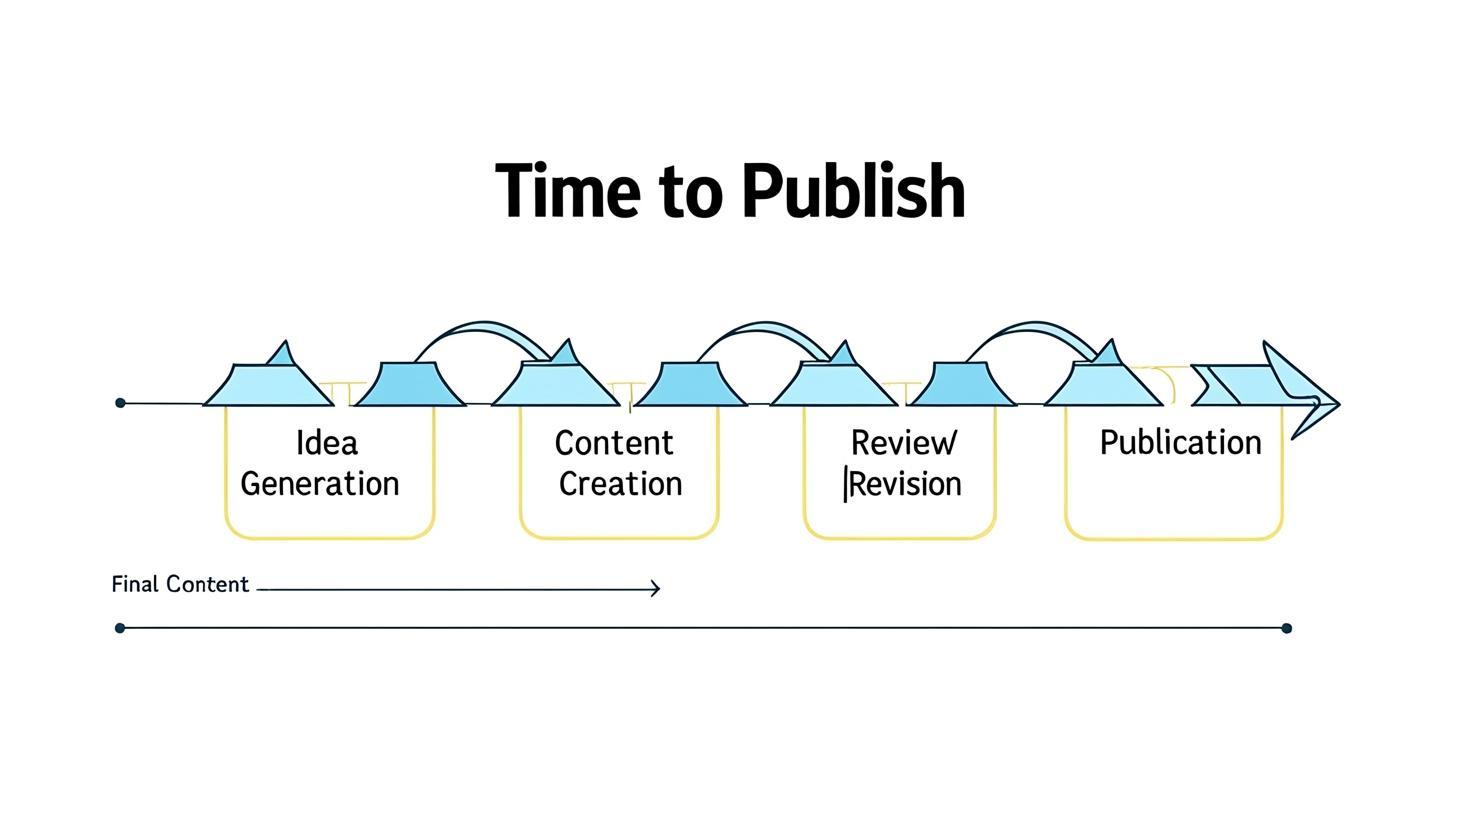
You can see that there are lots of places where things could slow down.
Production Cost:
Production cost is just the amount of money you spend to make your content. You can track it for all your content or for just one specific piece.
Knowing your production cost helps you figure out if you're getting a good return on investment (ROI). It’s super helpful when you need to decide where to put your money.
For example, imagine you spent a lot creating an article, but it didn’t perform the way you expected. You might want to look at similar topics and think about whether it’s worth covering those kinds of subjects again.
Distribution Cost:
Distribution cost is basically how much you spend to get your content out there and seen by people. It could be stuff like paying for ads on Google or Meta, sending press releases through a PR network, working with influencers to talk about your content, and more.
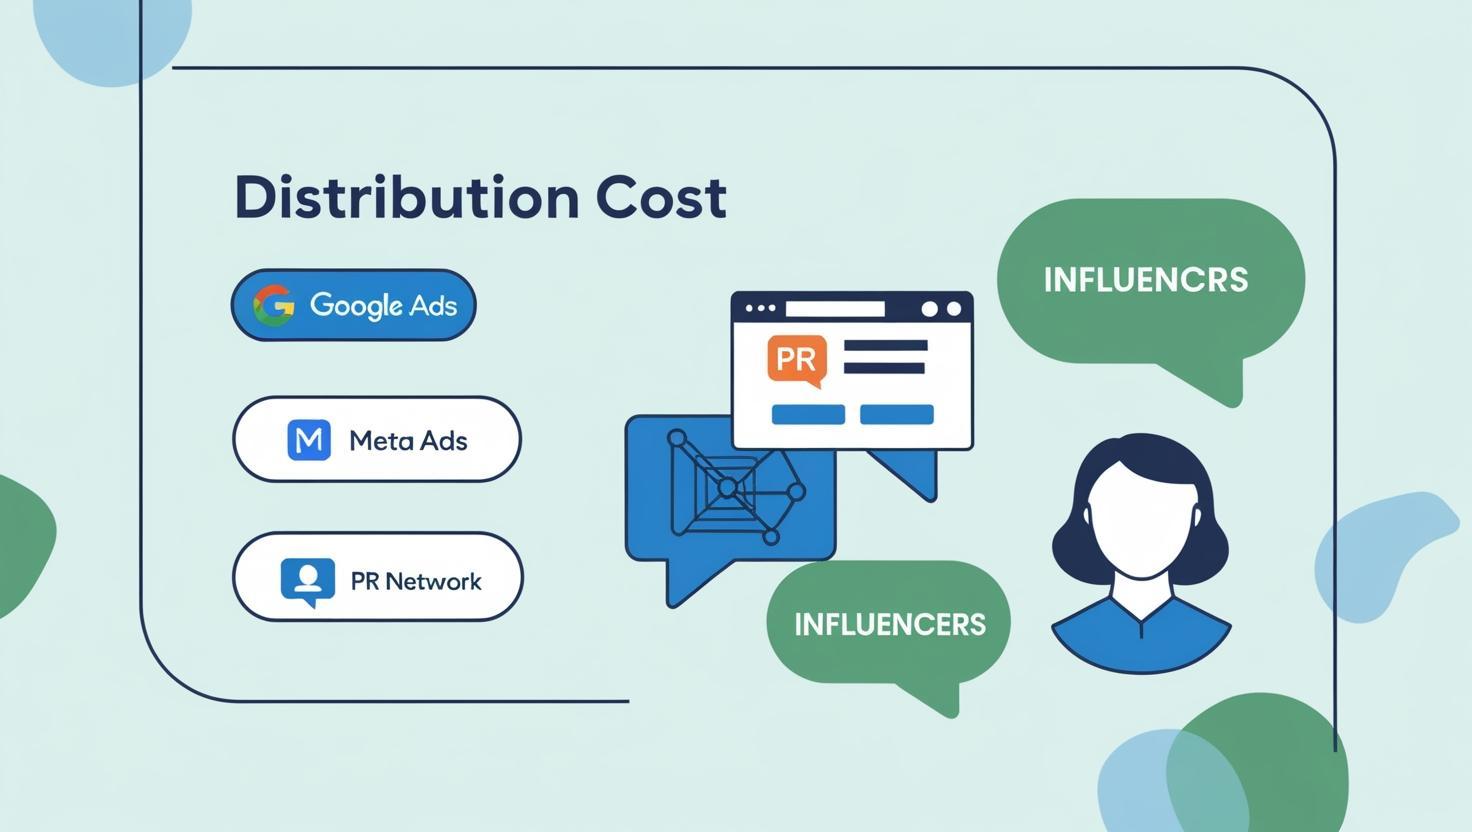
It's really important to keep track of these costs so you can see if your money is being well spent.
By doing this, you can figure out if some channels work better for your budget than others.
Tools for Comprehensive Content Performance Tracking
To keep track of how well your content is doing and make it better, you need to use a bunch of tools that give you more than just basic stats. Here's a quick look at the main types of tools and some good ones in each category:
1. Web Analytics Platforms
Web analytics platforms are super helpful for keeping track of how well your website is doing. They give you all kinds of info about how users behave, where your traffic comes from, and how well you're converting visitors.
Google Analytics 4 (GA4) is one of the best out there. It goes beyond just counting page views by looking at specific actions users take. It even uses machine learning to predict things like whether someone might make a purchase or how much money you could make. Plus, it's designed to respect privacy, with features like tracking without cookies and giving you control over your data.
For people using WordPress, Jetpack Stats is another great tool. It gives you real-time stats right in your WordPress dashboard, like how many visits you’re getting, which posts are the most popular, and where your traffic is coming from. It's simple to use and respects privacy laws, too.
Both GA4 and Jetpack Stats give website owners the data they need to make smart choices and improve their online presence.
2. Jaggery Consulting
Jaggery Consulting is a handy tool that helps boost your website’s search engine performance.
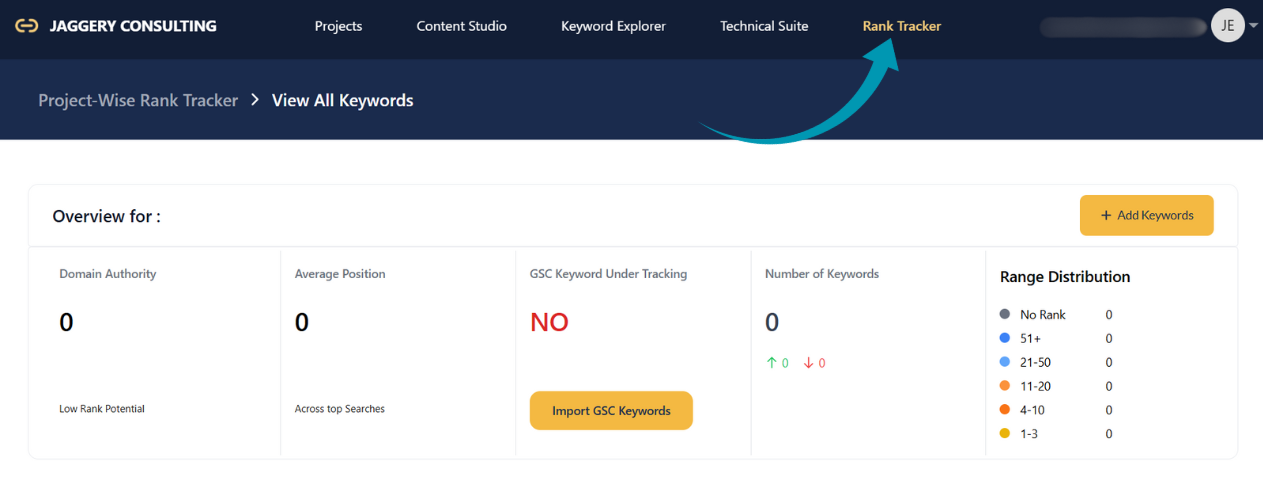
It lets you keep track of where your site stands in search engine results, so you can see if your SEO efforts are working.
It also connects with Google Search Console to help you see which keywords are bringing people to your site and how they’re doing.
Plus, it shows you how your rankings are spread out, so you can spot areas where you can improve and find new opportunities for growth.
3. Heatmap and User Behavior Tools
Heatmaps and user behavior tools are super helpful for seeing how people use websites. They help businesses make their websites better so more people stay and engage.
These tools show areas where users click, scroll, or move their cursor, using color to make it easy to see. For example, Hotjar shows a mix of click, move, and scroll data, so you can understand how people are interacting with your site.
Mouseflow has six types of heatmaps, like click, scroll, and even attention, to track everything users do. Microsoft Clarity is a free tool that shows heatmaps and recordings, so you can watch how people use your site.
By using these tools, businesses can figure out what people like, fix problems, and improve their website.
Conclusion
Today, it’s super important to know how your content is doing online. Just looking at simple things like page views and bounce rates won’t tell you much. You need to check out more advanced stuff, like how people are engaging with your content, whether they’re converting, how it’s doing on search engines, and even what people are saying about your brand on social media. There are tools that can help you keep track of all this. By taking the time to look at this data, you can make smart choices and keep improving your content. By using these tools, you’ll get a better idea of what your audience likes and make your content even better.
Frequently Asked Questions
How can I see if my content is helping with brand awareness?
Check out things like how often people talk about your brand on social media, how many people are mentioning it, and how much traffic is coming to your site. These show you if your brand is getting noticed more and more.
Why is sentiment analysis important for content?
Sentiment analysis looks at how people feel about your content. Are they happy, angry, or just neutral? Knowing this helps you understand how people are reacting and if your content needs to change to match what your audience likes.
How can I track how my content is doing everywhere?
Use a tool that brings all your data together in one place. This way, you can see how your content is performing across different platforms without checking each one separately. It helps you make better decisions for your next move.
What are some cool tools to track content performance?
Tools like heatmaps, session recordings, and AI that predicts trends can give you a better idea of what users are doing on your site. These tools show where people click and scroll, helping you know what to improve.
Why does scroll depth matter for content?
Scroll depth shows how far people read through your content. If they stop too soon, it means your content might not be grabbing their attention. Knowing where they lose interest can help you adjust and keep them reading.